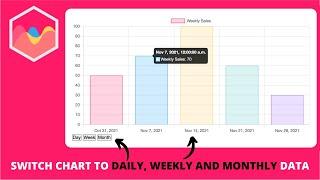
How to Switch Chart to Daily, Weekly and Monthly Data in Chart js
Комментарии:

Another great video! Anyway can you show us how to do the same task to select amongst day, week and month but reading form a single data structure/array with days from a CSV files. So, I would upload a file of all days in a DB and have those dates displayed either by day, month, or week without having to manually write the code to read in an array for each specific time range.
Ответить
I need to convert 5 year daily data from a stock market to hourly and minute wise. Help needed please. Stock market runs 5 days a week, for limited hours in the day. Also, it has graph given, that is real time. But the issue is data is daily.
Ответить
Amazing tutorials, can you do a tutorial on filtering the results from the database using checkboxes?
Ответить
Hi, I'm not able to figure out the 'const day = ' part as I have a multi-line chart. Can you help?
Ответить
Is there a way to change that label also when changing chart.
In this case label is always static “Weekly Sales”.
I need to change it based on Day, Week, Month.
Like Daily Sales, Weekly Sales, Monthly Sales.

the first label will only show when you start afresh .....for eg on 12 am , on a sunday, on a first day of the month
Ответить
chart2.html:72 Uncaught TypeError: Cannot read properties of undefined (reading 'scales')
Ответить
Hello sir. Can you do a video of this using dynamic data (from database - mysql)?
Ответить
How can I use more than one charts using same code in single one page, as I tried by changing the ID and const declaration names also changed config to config2 for second chart but only first chart is visible and the other not ?
Ответить
The week doesn't balance on the chart...
Ответить
Well done, thank you for this video. I encountered a problem with period date values. the chart leaves the last bar chart without a label. so in my array if i start my date from 2022-04-20 it starts from the 19th and then leaves the last chart to the right without a label but on hover it as a value..what can i do?
Ответить
Hi, I do the same but on the angular, did everything according to the lesson, but when you click the schedule is not updated and there is no method to update, please help, please
Ответить
Thanks for the helpful video. How to modifiy in order to process running timestamp from mysql DB instead constant time values?
Ответить
very good tutorial but if we do this work in a dynamic project what should we do?
Ответить
please sir make this video using php & mysql
Ответить
hello, very good tutorial! but instead of the dates you are passing I want to pass values that I reatrieve from the database. How can I do that? thank you
Ответить
This tutorial is really good, but I'm kinda having a hard time doing the same thing for my pie chart.. hope you can also do a tutorial for that.
PS. Love all your Tutorials your really good at explaining things! Helped me a a lot in setting up my charts !

Is the source code for the chart located on web server? this runs normally when internet connection is available but without internet it just returns an empty screen....please let me know if the source code for the same is available to be able to run this chart locally.
Ответить


