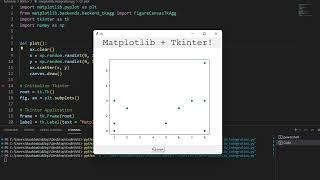
Embedding a Matplotlib Graph into a Tkinter application
Комментарии:

Thanks. very helpful
Ответить
Where is the data of the random points stored? The old random points were remembered and displayed when "Plot Graph" is clicked so they must be getting stored somewhere.
Ответить
Sir can you tell how to do same thing with plotly module
thank you

How can I change canvas size ? I need smaller canvas and graph. Thanks
Ответить
Excellent. Thank you for sharing your knowledge. Could I suggest a follow-up video whereby the matplotlib graph is animated?
Ответить
Extremely helpful… Thank you for taking the time to make this!
Ответить
I need to convert a python program source code to its exe using pyinstaller or auto py to exe but it always gives me error while converting of modules not found using--one file option
Using--one dir the exe works
Can you help me out
I am actually trying to convert an open source app available on github need to modify it and pack it back again into exe

Nice
Ответить
This is exactly what i was looking for! Thank you for the comprehensive video. Is it possibly to draw datapoints on the canvas iteratively? For example if i want to show a graph over time and want to display how the graph develops over time?
Ответить


![ASMR Roleplay: Taking A Ride w/ Your Dominant Boss [Brat Tamer] ASMR Roleplay: Taking A Ride w/ Your Dominant Boss [Brat Tamer]](https://ruvideo.cc/img/upload/WTZ3RHBOVWJFeVU.jpg)


