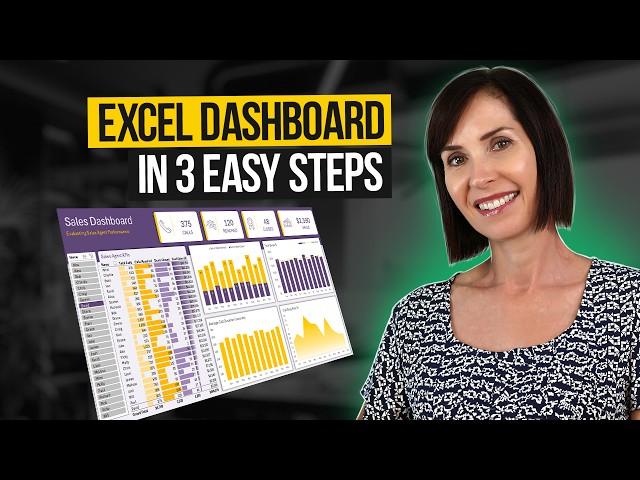
Interactive Excel Dashboard Tutorial in 3 Steps (+ FREE Template)

Interactive Excel Dashboard Tutorial in 3 Steps (+ FREE Template)

MyOnlineTrainingHub

4 месяца назад

99,227 Просмотров

Ссылки и html тэги не поддерживаются


Комментарии:

@IamTheReaper911
@IamTheReaper911 - 13.02.2024 20:05

That dashboard is................


........EPIC 😎

Ответить
@Cognacisabeast
@Cognacisabeast - 13.02.2024 19:11

Year 2006........Divine intervention.......................I was at St Mary's church and I went up for Holy Communion back to my pew kneeled down and I felt the Holy Spirit go into my heart that was much stronger than any other occasion when god struck my heart at the time. Well just moments later, I was in my basement listening to the Christian song, " He's Got The Whole World In His Hands ". I then reached into my pocket and pulled out the picture of the Holy Face Of Jesus Christ and held the picture up to the light and said that looks like Jesus, he looks like a Jesus , that is Jesus and once again I felt the Holy Spirit go into my heart. I then left from my house and went straight to the Sandusky Library and as I was walking toward the bench which leads to the path of St Mary's Church I wispered under my breath the words ( I would rather keep this to myself and not put my biz out there like that ) Well just moments later as I was getting ready to cross the street these two dudes who's names are Ryan and Thomas came running up and shouted out to me " HEY DO YOU KNOW ANYTHING ABOUT JESUS CHRIST " I was deeply alarmed and surprised. I then remembered that I was carrying the picture of the Holy Face of Jesus Christ Shroud of Turin and I was also carrying the Dvd The Gospel of John

Ответить
@mohamadkuk
@mohamadkuk - 13.02.2024 18:34

This is awesome! thank you for this

Ответить
@sseemm
@sseemm - 13.02.2024 18:30

Thanks Mynda,
One tiny tiny remark : it would be great to drop the name in the filter section of the pivot table and use it for the conditionnal formatting instead of using another pivot table with names in the rows.
bcz, if the prson didn't select any name from the slicers, we will still have "Alex" being highlighted in the table,
but if we add filter to the first Pivot table, we can use it as the base of our conditionnal formatting. The filter will either show "All"" or "the active name in the slicer"

Ответить
@DiamondRock2
@DiamondRock2 - 13.02.2024 17:46

Amazing work Mynda, thanks for all the effort ❣

Ответить
@aliniosif13
@aliniosif13 - 13.02.2024 17:37

learned a lot, you're a star!

Ответить
@abdelkaioumbouaicha
@abdelkaioumbouaicha - 13.02.2024 17:31

📝 Summary of Key Points:

📌 The presenter demonstrates how to create an interactive dashboard in Excel using fictional outbound sales call data. They follow three steps: cohesive design elements, analysis and visualization of metrics, and adding interactive elements for data exploration.
🧐 The presenter sets up the dashboard canvas, changes the color theme, and adds headings. They insert shapes for key performance indicators (KPIs), icons for metrics, and a slicer to filter data based on salesperson names.
🚀 The presenter formats the data as an Excel table, creates a pivot table for analysis, and adds number formatting and slicers for filtering. They also insert text boxes to display KPI values and labels, and format them accordingly.
🚀 The presenter creates pivot tables and column charts to visualize the data. They format the charts, add titles, and adjust the axis settings. They also add conditional formatting to highlight selected salesperson names in the KPI table.
🚀 The presenter demonstrates how to update the dashboard with new data by copying and pasting it into the data table and refreshing the dashboard.

💡 Additional Insights and Observations:

💬 "The dashboard is designed to analyze and visualize key metrics from fictional outbound sales call data."
📊 The presenter emphasizes the importance of cohesive design elements and visually appealing charts to create an informative dashboard.
🌐 The video provides a step-by-step guide and practical tips for creating an interactive dashboard in Excel.

📣 Concluding Remarks:

The video offers a comprehensive tutorial on creating an interactive dashboard in Excel. By following the presenter's three-step process, viewers can learn how to design, analyze, and visualize key metrics effectively. The use of fictional sales call data makes it easier to understand and apply the concepts demonstrated in the video. Overall, this tutorial is a valuable resource for anyone looking to create informative and visually appealing dashboards in Excel.
Generated using TalkBud

Ответить
@SergioAlejandroCampos
@SergioAlejandroCampos - 13.02.2024 17:28

Hi Mynda. I love your video editing.

Ответить
@chrism9037
@chrism9037 - 13.02.2024 17:10

Awesome dashboard Mynda!

Ответить
@sseemm
@sseemm - 13.02.2024 16:50

Thank you so Much Mynda.
one question please: where do you get fictional Data, is it generated by a website or just by yourself?

Ответить
@hanisalehal-ssenai1431
@hanisalehal-ssenai1431 - 13.02.2024 16:25

Thanks so much

Ответить
@SothearithKONGMrMuyKhmer
@SothearithKONGMrMuyKhmer - 13.02.2024 16:14

Thanks so much for this tutorial. 🥰

Ответить
@Shaft0
@Shaft0 - 13.02.2024 15:10

Good to see you fixed the account issue 👍

Ответить
@user-ti4xg3gb7v
@user-ti4xg3gb7v - 13.02.2024 15:08

Superb video.

Kindly share one for sales vs purchases and usage.

Thank you.

Ответить