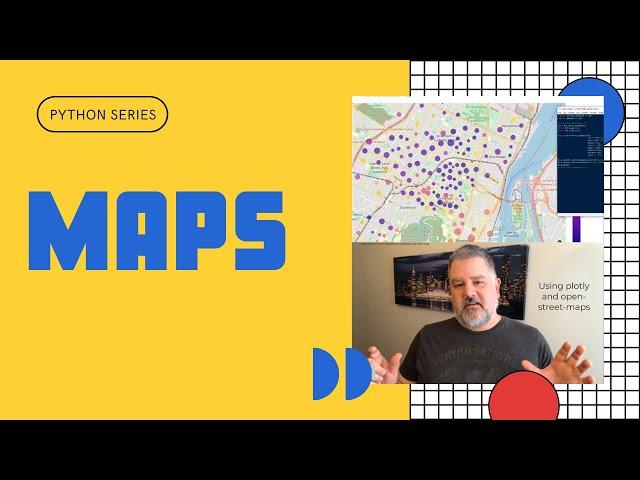
How to Make Interactive Maps with Python - Scatter Mapbox Example with Plotly and OpenStreetMap
Комментарии:

Amazing video. Thank you very much, very helpful
Ответить
ale krasny ten mapper
Ответить
Hi Sean, what data set should I use to get similar result for my area(Manchester United Kingdom)?
thanks

Perfect a very well explained video, and very useful, you earned a like an a new follower!
Ответить
Thank you!!
Ответить
Great explanation Sean, thanks a lot. I'm wondering how could I really interact with the map and not just see basic Info automatically provided by Plotly when we go over the marks, I mean, let's imagine we have a dataset of passengers of some car and I want a list of them when I click in some one, how could I do that? Another doubt is, can I use Google Earth to render the map? Thanks in advance.
Ответить
is scatter mapbox free?
I thought it costs money to use it

thank you for the explanation! I tried to implement this basic example. When I run it, a new tab in my browser opens. However, the plot won't show. In fact, I cannot establish a connection (ERR_CONNECTION_REFUSED). What can be the reason for this?
Ответить
Very Nice.
Ответить
How to make an arrow by using scatter_mapbox toindicate direction?
Ответить
Hi sean my data tells can only concatenate str (not "int") to str and sometimes i also get unsupported operand type(s) for /: 'str' and 'int' and i dont know when i try to use the scatter_mapbox
Ответить
I just want to thank you, Sean. You have helped me a great deal!
Ответить
is it possible to animate a tracking plot? Thank you.
Ответить
The coding line for "Margin" is not working for IDLE shell 3.10.7. The colons are giving errors when you are putting it in.
Ответить
I run your code on my dataset It just show the errors that fig is not defined. Is there anything I should define or import before running?!?
Ответить
Hi, I have copied your code and tried to run it in colab but I am getting just the title and blank white box in place of the map.
Is there any solution to get that map in colab?
what I am missing here?

HI Sean,
First of all, this is a BRILLIANT VIDEO!
Will you guide me to resources where we can plot a storm/typhoon paths
Roadways, shipping vessels paths ...

How can we move the legend above the map as horizontal?
Ответить
how to plot lat/long coordinate in ms access?
Ответить
Hi. I have a question how do I implement a joining line for distance wise from a start point and end point, lat and lon with mapbox access token
Ответить

![[FREE] "MYSTIC" Reggae Bob Marley Type Beat - Guitar Version [FREE] "MYSTIC" Reggae Bob Marley Type Beat - Guitar Version](https://ruvideo.cc/img/upload/Yzg4cGlQQ0ZFdkc.jpg)


