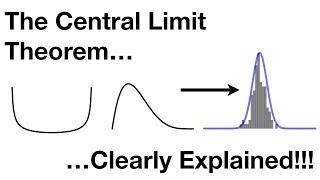
The Central Limit Theorem, Clearly Explained!!!

The Central Limit Theorem, Clearly Explained!!!

StatQuest with Josh Starmer

5 лет назад

748,470 Просмотров

Ссылки и html тэги не поддерживаются


Комментарии:

Galaxy55
Galaxy55 - 29.10.2023 23:22

Quadruple BAM!

Ответить
Soumik Mitra
Soumik Mitra - 25.10.2023 19:01

BAM

Ответить
CHORAGUDI DEVESWARA
CHORAGUDI DEVESWARA - 23.10.2023 12:17

HMMMMMMMMMM..........

Ответить
L L
L L - 23.10.2023 07:33

Hey Josh, can you please clarify what is 'sample size 30 rule'? Is it that we have to have at least 30 sample groups (however units in each sample groups); or in each sample groups, we have to have at least 30 units (doesn't matter how many sample groups we collect)? I am consistently confused by 'sample size' from many resources, thanks for your clarification!

Ответить
ABBAS JIVANI
ABBAS JIVANI - 22.10.2023 13:54

The guy made the concept easy peasy lemon squeezy!!😎

Absolutely loved the way the things were elabrated.😍

Ответить
Willy Octavianus
Willy Octavianus - 17.10.2023 16:17

oof.. this video is quite underrated... well narrated, interesting, and simple

Ответить
asianslayer555
asianslayer555 - 10.10.2023 08:04

I finally understand this after so many years! Thanks and Double BAM!

Ответить
Daniel Diaz
Daniel Diaz - 01.10.2023 22:32

random samples correct?

Ответить
Kalyan Karakheti
Kalyan Karakheti - 15.09.2023 08:39

Even if you're not normal, the average is normal!!! 😂

Ответить
Srinivasan Sivaramakrishnan
Srinivasan Sivaramakrishnan - 07.09.2023 10:01

)Hi Josh, Just to clarify - say I am not repeating the experiement - I only have 10 measurements that has come from an uniform distribution - i now have mean from the 10 measurements - but I am not repeating the experiment. In this case - that single mean can be assumed as normal or if the experiment has to repeated for M times ? Reason is if I dont repeat the experiment, I only have 1 data point (mean).

Ответить
konstantinlevin
konstantinlevin - 01.09.2023 14:22

Thanks a lot! I've tried the examples you gave with python. I sampled from uniform and exponential distributions, computed means and draw histograms and bam! This actually feels like magic. I'm looking forward to understand the theorem more. I read the wikipedia page and it actually seems like there are lot to learn!

Ответить
Meta Sameta
Meta Sameta - 17.08.2023 10:27

Bam🤣

Ответить
Janet Haufiku
Janet Haufiku - 17.08.2023 02:06

😂😂the theme song had me

Ответить
Sara Santos
Sara Santos - 15.08.2023 22:55

Thank you so much

Ответить
Organic chemistry
Organic chemistry - 04.08.2023 10:35

Thank you very much sir, i recently started my data analysis journey. Your videos were lot helpful

Ответить
Dhanush Binu
Dhanush Binu - 04.08.2023 00:08

Is there any simple intuition of why the central limit theorem works?

Ответить
Amitava Roy
Amitava Roy - 02.08.2023 12:17

I am a 4th Year UG at IIT Kharagpur and you will be pleased to know that almost everybody on campus loves your lectures on Probability, Statistics and Machine Learning and consider it to be the best resource for cracking company interviews. Absolutely brilliant content!

Ответить
VICTOR EBUBE MADUBUEZE
VICTOR EBUBE MADUBUEZE - 27.07.2023 06:32

I am taking biostatistics now and I find this very helpful. However, I have one question from my textbook. It says the number of neutrophils in a sample of 2 white blood cells (binomial distribution, I suppose) is not normally distributed, but the number in a sample of 100 white blood cells is very close to being normally distributed. How does this work here? IS it similar to the central limit theorem of taking different means and plotting a histogram for the data, or is there something else in play, please?

Ответить
Rohan
Rohan - 24.07.2023 16:38

Thanks for the crystal clear explanation Josh. BAM !!!

Ответить
David Appell
David Appell - 14.07.2023 04:32

Very unclear, talking about “50 means” etc.

Ответить