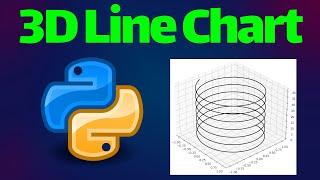
3D Line Chart Plotting in Python using Matplotlib
Комментарии:

Tom Simpson - 27.01.2023 17:21
This is all great but how can these charts actually be used with real data? Random numbers are pretty useless if you are trying to build one of these graphs that is actually usable.
Ответить
Up Graduate - 16.11.2022 02:41
Very nice explanation
Ответить
Fazit schreiben der Bachelorarbeit & Hausarbeit
BachelorPrint
The Alaskan Sawmill for small logs and lumber!
The Saw Dust Dude
Kahile Kahin Manka Kura | Udit Narayan Jha | Karaoke
Global Nepal Entertainment
LIVE AT DADALAB AUSTIN, TX AUGUST 17
Joseph Salazar


