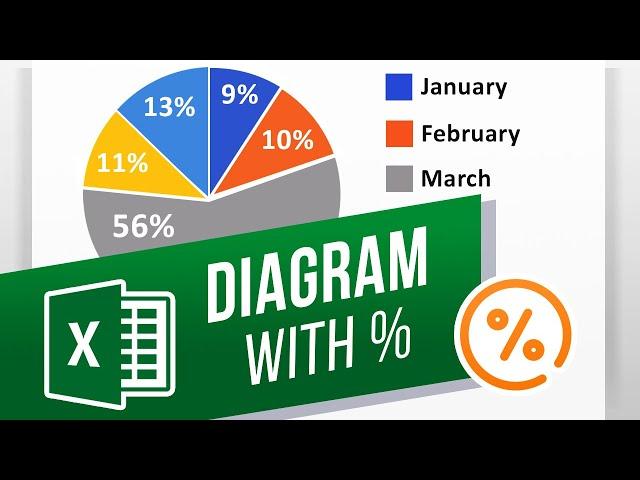
How to Make a Diagram with Percentages in Excel | How to Create a Pie Chart in Excel
In this tutorial, you will learn how to Make a Diagram with Percentages.
If you want to see your percentages in a data chart, here is what you need to do. For this tutorial we already have some data to create a chart with.
Select 2 cell ranges A2:A6 and C2:C6 (while holding down the CMD for mac or CTRL if you are on windows). Then use this data to build a chart. Go to insert tab - Pie Chart icon and the type of a chart. If you want to add data labels, select the graph and click the plus icon and turn on data labels.
With charts, it’s important to make sure that you are displaying percentages as opposed to regular numbers to not create any confusion.
❓💬 What questions do you have about Pie Charts? Let us know in the comments below.
#HowTech #Excel #Percentages
--------------------------------------------------------------------------------------------------------------
✅ All our announcements are available here https://t.me/howtechtv
✅ Commercial questions [email protected]
✅ Instagram https://www.instagram.com/howtechprojects
✅ Twitter https://twitter.com/howtechprojects
Тэги:
#howtech #excel #create_a_chart_in_excel #create_a_diagram_in_excel #diagram_with_percentages_in_excel #percent_charts_in_excel #display_percentages_in_excel_chart #make_a_pie_chart_in_excel #edit_a_pie_chart_in_excel #format_a_pie_chart_in_excel #customize_pie_charts #basic_pie_chart #chart_with_numbers_and_percentages #draw_a_pie_chart_from_percentages #excel_charts #excel_features #excel_tricks #excel_tips #excel_hacks #excel_learning #excel_basics #excel_for_beginnersКомментарии:

Pancho Alaisah pancho - 06.09.2023 08:47
Thnkyouu
Ответить
Mara Rulle - 14.03.2023 10:15
SHORT AND COOL
Ответить
How to Make a Diagram with Percentages in Excel | How to Create a Pie Chart in Excel
Excel, Word and PowerPoint Tutorials from Howtech
(Maroon 5) Memories - Fingerstyle Guitar Cover | Josephine Alexandra
Josephine Alexandra
Solo Overnight in survival Bunker | Crafting stone table,wood fork & haunted swamps exploration
Cyprien Outdoor Adventures
Man Over 40? How to Get LEAN and Build MUSCLE in 2024!
Coach CC Matthews
Membuat rangka alat tanam padi elektrik
Tani Maju
#kratos #baldur #gow
Malagollii
"RANK 1 IS BACK!" - ATF counters SF mid with his BEST HERO..
PLAYER PERSPECTIVE DOTA 2
Men saga bakyt kaalaim bul omurdo...@
Elaman Turganbekov


