Комментарии:

I used AutoCAD Civil 3d and ESRI for years. Nice work!😊
Ответить
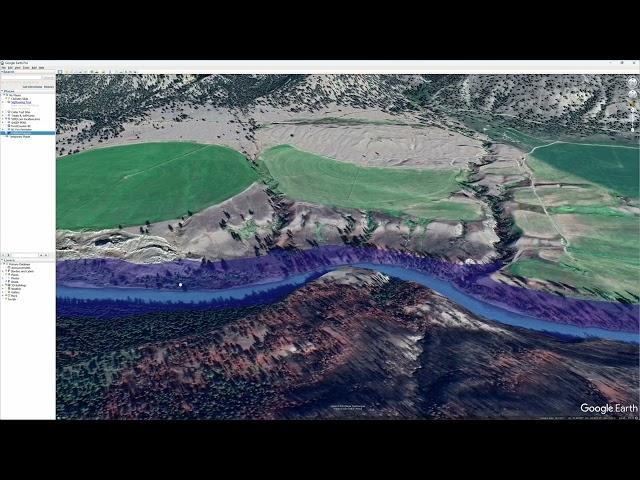
I had wondered that myself, but until you put the blue elevated section up, I couldn’t picture exactly what it would look like that’s a lot of water
Ответить
How many tons of water are building up behind the blockage?
From that, you can calculate the amount of energy that will be released.
They should be digging a trench to start the release of water ASAP.

Should make a dam downstream while it's dry and maintain the level for irrigation.
Build the fish passages and done.
Alex Fraser or WAC Bennett would do it for the Chilcotin.......

Look at where the chilcotin meets the fraser. The east side once slid and will slide again. If this wall hits the fraser there might be a slide that blocks both.
Ответить
good work.
Ответить
Where is chilcoten?
Ответить
Great analysis! Hopefully Farwell Canyon doesn’t get too jammed up with logs as the river narrows there substantially. Also wondering if anyone knows if there were any commercial rafting trips on the river at the time? Feel bad for those companies as this is prime time for them.
Ответить
This was a nice presentation, well done !
Is it also possible to do a 'worst case' scenario, where the water would break the dam in 1 time, and say, a flash flood of +/- 20meter goes through the valley ?
Ofcourse this is probably a bit harder to simulate, because the flash flood would get less and less high as it flows through the river.

Nice job. It's going to take quite a while before the water rises to 30 m, where it will begin to overtop the slide. It's too bad there hasn't been a lidar scan of the slide so we could see what the actual level is and what the possible path(s) might be for the water to flow.
Ответить
Interesting, thanks for putting this on the web.
Ответить
great graphic. nothing really to worry about upstream but downstream is still a question mark at this time. thank you.
Ответить
Probably, as good as can be done from a first approximation. The views I've seen of the slide foot seem to show that horizontal folding in line with the original river route occurred, so those may act as channels and depending on that 30m calculation (min/avg/max) it may commence reflow below that level however it was devised. Good stuff.
[any depth gauges along that span?]

Cool! Thank you
Ответить
I cant recall EVER seeing such an event as what is unfolding in BC.
This is a genuinely frightening part of Nature,....a REMINDER of sorts that Humans are not its MASTERS, but are its CHILDREN❤

Every bend was a slide and the water goes around not over top or eventually bends around. I predict same.
Ответить
A few hours of aerial lidar surveying, over the slide and some topo calculations a path for where the water will potentially make its way through.
Ответить
The local gov added the banks of the Chilcotin upstream from the prior evac area to near Hanceville. I wonder if 30m max depth has changed to 40 or 50m? That could be bad.
Ответить
Cool vid. It's "not that bad", but also a huge volume of water at the same time.
Ответить
That was a better review of the possible affects than any news station has offered.
Ответить
No trees in area to hold the land in place 🙄
Ответить
What the hell are they going to do let the water go where it wants to? they could have blasted a path down through the slide and made an opening for the water to travel onward instead of allowing it to build up and cause catastrophic damage down stream, why haven’t they done something or tried something before the water gets to a critical point of flash flooding everyone down river.
Ответить
wonderful video, need to do something to muffle those mouse clicks.
Ответить
Thanks for this. Good job.
Ответить
I guess this could give comfort to those up stream of the blockage!
Ответить
Search “William’s Lake First Nation, Fly Over the Chilcotin River Landslide.” for a great aerial view of it. 🤙
Ответить
Wouldn’t a new lake be nice?
Ответить
Oh dear, you must hurry and save nature from itself.
Ответить
That is a lot of water
Ответить
Nice work! Any thumbnail estimates of volume?
Ответить
I had no idea you could do that on Google earth! Very cool and thank you!
Ответить
Nice work, thanks and bless& miracles for all involved in this Chilcotin slide… 😎♾️🇺🇸
Ответить
Great job!!
Ответить
Amazing.
You just provided the single most useful Explanation of exactly what we're dealing with and what the real risk is.
I don't know how to do it but can you take this one step further.
How long will it take for that volume of water to fill the reservoir that you have created With your model?
Obviously the assumption would be that the land slide will hold until the reservoir is full. Any chance you can come up with that answer? I have subscribed and am following

if the government is that concerned the can dynamite a channel into the slide, the water flowing through will do the rest.
but I hope the leave it to form the lake area, eventually water will find its way over/through the slide and nature will set its new normal.

This is all predicated. Upon the assumption he won’t have more landslides downstream, raising the level more . Or when the water backs up a landslide occurs again, and all that water goes down stream in a big hurry
Ответить
The issue is that the landslide is loose media. if/when it spills, it's likely that one of two things will happen: (1) it dislodges the landslide and comes down all at once, or (2) it overtops, but quickly erodes the media, turning into a torrent of water (much like those videos of folks connecting rivers to the ocean through sand - a small trench turns into a 20 meter wide torrent in minutes)
Ответить
So much more reasonable than fear mongering media!
Ответить
Nicely done. That slide is about 40 minutes by road from here. The authorities are trying to keep everyone away from the site and have banned the use of the airspace above to everyone not on "official" business. No drones, nothing. Easy to control what news is given when the narrative can't be checked.
Ответить
Great visualization
Ответить
I am not sure if the 30m height of the dam is from the original surface of the water or from the bottom of the river bed. However this visualization gives a very good representation of maximum lake size.
Ответить
You can see previous slippage all the way along the banks, there could be more slippage yet...
Ответить
The raised river will probably cause more slides and more debris will add to the slide area.
Ответить
Cool graphics, I don't think the dam with bust open to wide and full of logs.
Ответить
Reckon it will be a couple of months before folk really need to worry downstream.
Ответить
Please normalize your audio to -3 Db.
Ответить
Great video!
Ответить
wow and the Australian govt could not do this poly when they flooded us can see to the tree where water is coming to top job mate
Ответить


