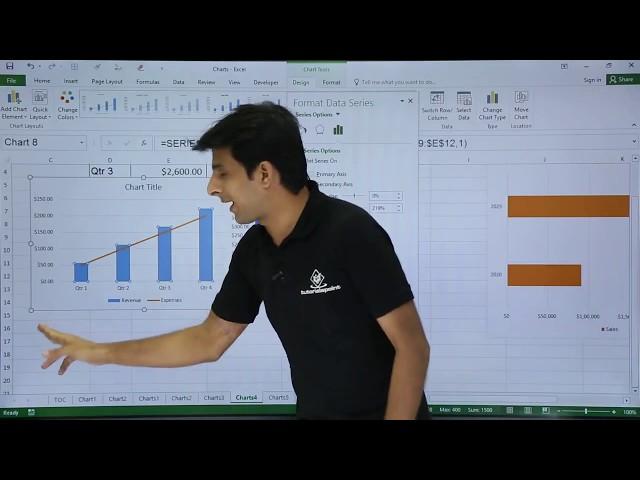
MS Excel - Pie, Bar, Column & Line Chart
Комментарии:

At this point we all should just drop outta school nd study from videos , i mean that’s just sooo much more convenient!
Ответить
Really thank you sir 😊
Ответить
Well explained. Appreciated
Ответить
Sonu nigam is such an amazing teacher
Ответить
Nice
Ответить
Needs to be in the world of the world of the world of the world of the world
Ответить
Thanks for explaining 😊
Ответить
Thank you, you have made a difficult task very simple for me. very grateful
Ответить
Ossum
Ответить
such a great explannation lots of love from Pakistan
Ответить
It was really best work done by you sir it was really help for us thanks a lota sir
Ответить
thank you sir
Ответить
Thank you sir
Ответить
Most informative sir
Ответить
Thank you
Ответить
excellent
Ответить
it is good for studens
Ответить
You're just brilliant
Ответить
Amazing sir😊😊
Ответить
Sorry is not my topic
Ответить
Please show industrial waste disposal graf chart
Ответить
please provide practice file
Ответить
rahul bhatt😎
Ответить
Good Teaching👌👌
Ответить
Your English is very good sir
Ответить
Namaste
We can use power BI desktop for easy graphical charts

Very well explained sir
Ответить
Fabulous teaching! Spellbound, anybody can learn from this video.
Ответить
so nice chart explanation
Ответить
Thank you so much Sir. Its very helpful. Love from Eastern Nagaland.
Ответить
your teaching style is so awesomeness
Ответить
I am unable to find radar chart from your channel
Ответить
Teaching skills are awesome sir
Ответить
Hello sir, could you please help me in preparing the following type of charts:
1. Some data is given for the allocation of funds to some divisons of an office for two financial years and I was asked to prepare year-wise Percentage allocation for each division in a Bar chart
2. Similarly in second scenario the net salary of some employees is given and I need to plot a bar chart for the percentage net salary of each employee
Sir please help me as it is required urgently...
Thanks in advance.. ।

Sir i want to learn ms office
Ответить
In MS Excel which of the Following is not a chart type. Sir answer?
Ответить
3million soon sir
Ответить
Thanks a lot 🙏🙏
Ответить
Very good demonstration of the charts.
Ответить
Thanks sir
Ответить
can you explain more because I have a exam at wensday pls
Ответить
what are statistical graph/operation in excel
Ответить
Very much useful thankq soooooooo much
Ответить
Thank u so much...it has helped me in various interviews
Ответить
..
Ответить
I can't deny the fact that I have learned a lot from your tutorials. Thank you
Ответить
are column chart and bar chart the same? whats the difference?
Ответить
Is the plus(+) sign that allows the graph to be edited strictly associated with a particular excel version or all versions please?
Ответить


