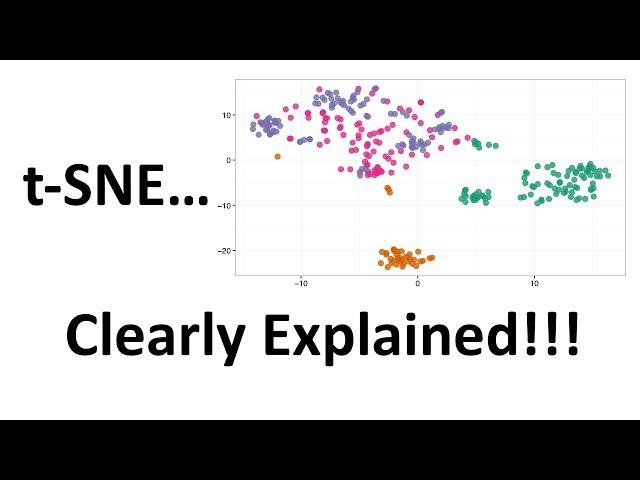
StatQuest: t-SNE, Clearly Explained

StatQuest: t-SNE, Clearly Explained

StatQuest with Josh Starmer

7 лет назад

485,552 Просмотров

Ссылки и html тэги не поддерживаются


Комментарии:

@sarasardar8282
@sarasardar8282 - 15.07.2022 12:46

love it!!

Ответить
@ShubhamKumar-ws3lo
@ShubhamKumar-ws3lo - 02.09.2022 08:16

Great Explaination. Could you explain how normal distribution function standard deviation dependent on the neighbouring points ? Thanks in advance.

Ответить
@manaspratimdas5758
@manaspratimdas5758 - 07.09.2022 15:14

How to plot the similarity score heatmap for high and low dimensional representations in python?

Ответить
@kabirbaghel8835
@kabirbaghel8835 - 18.09.2022 17:38

haiyaaan

Ответить
@teresitaeyzaguirre4741
@teresitaeyzaguirre4741 - 03.10.2022 18:51

hey Josh! great video as always. Is it necessary to normalize or scale the data before applying this algorithm?

Ответить
@dr.kingschultz
@dr.kingschultz - 15.10.2022 18:49

Another amazing video! Please in the next one's include also some formulas and python code if you can.

Ответить
@ziba89
@ziba89 - 16.10.2022 21:02

thank you for this! quick question, is there an overall metric that can allow us to rate how well separated the clusters are by using this method?

Ответить
@tuongminhquoc
@tuongminhquoc - 29.10.2022 15:13

Thank you. I am not sure if you remember me from the PCA video. I have a job now. My job do not have high salary, but I could now support you by donating and thank you now. 😊

Ответить
@juanete69
@juanete69 - 30.10.2022 15:18

Yo hadn't explained how to move this points.

Ответить
@juanete69
@juanete69 - 02.11.2022 04:59

You don't have any tutorial explaining FFT interpolation.

Ответить
@veeek8
@veeek8 - 15.11.2022 20:56

Brilliant explanation, this has been bugging me all day, thank you!!

Ответить
@rajarshimaity1223
@rajarshimaity1223 - 18.11.2022 05:45

Great explainations!

Ответить
@alvarovs89
@alvarovs89 - 29.11.2022 06:28

Just hear about t-SNE and I did not quite understand how it works so I crossed my fingers hoping that josh did a video of this and of course he did!! haha
I have my popcorn ready to enjoy this video :)

Ответить
@TheAvithal
@TheAvithal - 31.12.2022 13:02

you are amazing

Ответить
@charafdev5702
@charafdev5702 - 25.01.2023 22:04

This channel should be named "Bam! Double Bam!!"

Ответить
@CalvinJKu
@CalvinJKu - 02.02.2023 11:21

Was nice and all but it'd be even better if you explained the perplexity part a bit more. Bam!

Ответить
@mic9657
@mic9657 - 14.02.2023 07:53

Amazing work! perfectly explained!!!

Ответить
@berkceyhan5031
@berkceyhan5031 - 17.03.2023 15:29

What happened to the double bam at the end?

Ответить
@Bedivine777angelprayer
@Bedivine777angelprayer - 19.03.2023 23:45

Thanks really great videos understood concepts so well

Ответить
@annnaj7181
@annnaj7181 - 16.04.2023 22:37

t-SNE stands for distributed Stochastic Neighbor Embedding

Ответить
@sudortd
@sudortd - 19.04.2023 14:27

I need to watch 3 more times to fully understand. TRIPLE BAM!!!

Ответить
@vishnumuralidharan9858
@vishnumuralidharan9858 - 05.06.2023 05:40

Hi Josh, I can't thank you enough for how much I have benefitted from your videos even though I do data science as part of my day job. Thank you so much for sharing your knowledge!
One request for a video: could you do a video of when to use which methods / models in a typical data science problem? Much appreciated.

Ответить
@adeoyeoladipupoibrahim3066
@adeoyeoladipupoibrahim3066 - 11.06.2023 16:32

please we need a manifold learning video

Ответить
@abhijitkumbhar1
@abhijitkumbhar1 - 24.06.2023 05:44

Difficult concept made so simple. Just brilliant!!!!

Ответить
@khaikit1232
@khaikit1232 - 26.06.2023 19:12

Hi Josh

Thanks for the amazing video and I just have 2 questions that popped up in my mind

1) Is my understanding correct that t-SNE does not actually know which points are in a cluster (yellow, red, blue)? t-SNE merely look at the 2 matrices of scaled similarity scores and at each step try to make the matrices more similar.

2) Regarding why the t-distribution is used, you explained that without it the clusters would all be clumped up be difficult to see. I don't really understand why the clusters would be clumped up?

Ответить
@Johncowk
@Johncowk - 21.07.2023 17:12

Can anyone explain what the perplexity controls precisely and why it works?

Ответить
@omarsalam7586
@omarsalam7586 - 16.08.2023 10:44

thank you

Ответить
@andyn6053
@andyn6053 - 12.09.2023 00:16

Please do videos about density estimation techniques such as GMM and KDE. Would also like to see Anomaly detection algorithms explained like i.e isolated forest etc.

Ответить
@MathPhysicsFunwithGus
@MathPhysicsFunwithGus - 16.09.2023 22:37

This is a great explanation thank you!

Ответить
@kimblylabs7137
@kimblylabs7137 - 14.11.2023 13:40

Spelling mistake Explalined

Ответить
@mattgenaro
@mattgenaro - 01.12.2023 04:47

best channel ever

Ответить
@AndrewDavidson-un2df
@AndrewDavidson-un2df - 30.01.2024 19:54

How is t-sne different than k-means? seems like the only difference is the similarity metric. any thoughts about why t-test similarity might work better or worse than euclidian distance? another great video! thank you

Ответить
@arenashawn772
@arenashawn772 - 11.02.2024 01:19

t-SNE in concept is a little dense to me so I am watching this video multiple times to think about the nitty gritty of it… I have three perhaps very naive questions so far: 1) with really high dimensional feature space for some data, how do t-SNE algorithms decide how many dimensions to use for the simplified data? In PCA it can be specified by inspecting the variance of data in each of the components to decide that new feature’s “contribution” in grouping/separating the datapoints, is there a similar measure that is used to decide how many dimensions are used in t-SNE? 2) Why is it only used as a visualization technique and not a true dimension-reduction method for data pre-processing in machine learning pipelines? 3) is it possible that the data do not converge in low dimensional space (i.e., you just could not move the second matrix so that it is similar enough to the first one)?

I dug out the original 2008 paper from SkLearn citation and as usual was amazed by how you explained the fairly abstract idea in section 2 of the paper in a mere 20-minute long unhurried video, down to the analogy of the repelling and attraction of mapped data in the low dimensional space (the original paper interpreted the gradient decent method used to locate the low dimensional mapping of points as “springs between every point and all other points”) — no important detail is lost in your video yet they are organized in such a way that they follow a clear logic and do not overwhelm. That is mastery of the art of elucidation ❤

Thanks as always for digesting these complicated items for the benefit of the students and present them in simplified yet informative ways, as always!

Ответить
@mjollnirboy
@mjollnirboy - 23.02.2024 12:32

Is the Similarity Score Matrix, in some way, related to the Confusion Matrix?

Ответить
@Tony-Man
@Tony-Man - 28.03.2024 13:26

Hi Josh, quality content! This channel continuously helps me to understand the idea behind so that the dry textbook explanations actually make sense. I still have a question. When you calculate the unscaled similarity score, how do you exactly determine the width of your guassian? I get it in the example that we already know the cluster. If I only want to visualize the data without having pre-defined clusters, what happens then?

Ответить
@neptunefinance
@neptunefinance - 01.05.2024 05:48

Thanks ! How should we find the right perplexity to use ?

Ответить
@np5855
@np5855 - 14.05.2024 23:50

BAM! 😎😂

Ответить
@J_Shreyash
@J_Shreyash - 19.05.2024 19:58

Josh bhai ne padhaya tho thek hai jayda mujhe kuch samaj me nhi aya, prr josh bhai thoda aur simple bata shakta tha.
Josh bhau ne thek shekavly, mala trr thodech kalale pn ajun josh bhau simple shekeu shakla asta.
Josh bhau lakshat theve he.
amhi nigto atta

Ответить
@MrCEO-jw1vm
@MrCEO-jw1vm - 18.06.2024 03:34

Thank you so much for this great resource and how much investment you have made into it. I have understood this well.

Ответить
@DumplingWarrior
@DumplingWarrior - 18.08.2024 09:41

Hi Josh, great videos as always! I'm not sure if there's a video about this already, but could you do one with all the clustering or classification or dimensionality reduction methods compiled together and then compare their differences and similarities and talk about situations when we should use which? For example, after looking at many of the videos, I think I'm already a little lost on if I should use PCA or MDS or t-SNE on my data. Ty.

Ответить
@abivu1700
@abivu1700 - 30.10.2024 00:21

is it only me who cannot make sense of what you're explaing? :( I know you're very popular with explaining concepts in Data Science, but I find it hard to understand. Sorry!

Ответить
@prelimsiscoming
@prelimsiscoming - 03.11.2024 07:47

Bam is very annoying

Ответить
@BitsNBytes_
@BitsNBytes_ - 13.11.2024 03:10

Thank you Josh, really appreciate your efforts for such a great content !

I've coded a Python script that will help fully understand t-SNE along with the video

```
"""
t-SNE (t-Distributed Stochastic Neighbor Embedding) is a popular technique for dimensionality reduction that is particularly well suited for the visualization of high-dimensional datasets.

It is a nonlinear dimensionality reduction technique that is particularly well suited for embedding high-dimensional data into a low-dimensional space of two or three dimensions, which can then be visualized in a scatter plot.

In this script, we will use t-SNE to reduce the dimensionality of a 2D dataset with three classes and visualize the results.
"""

import numpy as np
import matplotlib.pyplot as plt


##--- We first create three 2D example classes to work with

# Set the random seed for reproducibility
RANDOM_SEED = 42
np.random.seed(RANDOM_SEED)

# Generate 2D data for three different classes, each with points close to their class center
class_1 = np.random.normal(loc=[2, 2], scale=0.5, size=(100, 2))
class_2 = np.random.normal(loc=[6, 6], scale=0.5, size=(100, 2))
class_3 = np.random.normal(loc=[10, 2], scale=0.5, size=(100, 2))


##--- Now, let's visualize our 3 classes

# Create the plot
plt.figure(figsize=(8, 6))

# Scatter plot for each class with different colors and labels
plt.scatter(class_1[:, 0], class_1[:, 1], color='blue', label='Class 1', alpha=0.7)
plt.scatter(class_2[:, 0], class_2[:, 1], color='green', label='Class 2', alpha=0.7)
plt.scatter(class_3[:, 0], class_3[:, 1], color='red', label='Class 3', alpha=0.7)

# Customize axes
plt.gca().spines['top'].set_color('none') # Remove the top spine
plt.gca().spines['right'].set_color('none') # Remove the right spine

# Add labels and title
plt.xlabel('Feature 1')
plt.ylabel('Feature 2')
plt.legend()
plt.grid(True)

# Show the plot
plt.show()


##--- Let's use t-SNE to reduce the dimensionality of the data
from sklearn.manifold import TSNE

# Combine the data into a single array
data = np.vstack([class_1, class_2, class_3])

# Create the t-SNE object
tsne = TSNE(
n_components=1, # Reduce the dimensionality to 1
perplexity=30,
metric='euclidean',
random_state=RANDOM_SEED
)

# Perform t-SNE on the combined data
tsne_transformed = tsne.fit_transform(data)


##--- Let's visualize our data after using t-SNE
# Create the plot
plt.figure(figsize=(12, 5))

# Scatter plot for each class with different colors and labels
plt.scatter(tsne_transformed[:100], np.zeros(100), color='blue', label='Class 1', alpha=0.7)
plt.scatter(tsne_transformed[100:200], np.zeros(100), color='green', label='Class 2', alpha=0.7)
plt.scatter(tsne_transformed[200:], np.zeros(100), color='red', label='Class 3', alpha=0.7)

# Customize axes
ax = plt.gca()
ax.spines['top'].set_color('none') # Remove the top spine
ax.spines['right'].set_color('none') # Remove the right spine
ax.spines['left'].set_color('none') # Remove the left spine
ax.spines['bottom'].set_position('zero') # Position x-axis at y=0
plt.yticks([]) # Remove y-axis ticks

# Add labels and legend
plt.xlabel('t-SNE Component 1')
plt.legend(loc='upper right')
plt.grid(False) # Optional: turn off the grid

# Show the plot
plt.show()
```

Ответить
@sanskarsahu1045
@sanskarsahu1045 - 05.01.2025 13:22

You are replying to every comment !! I wonder if it is a bot or you 😂

Ответить