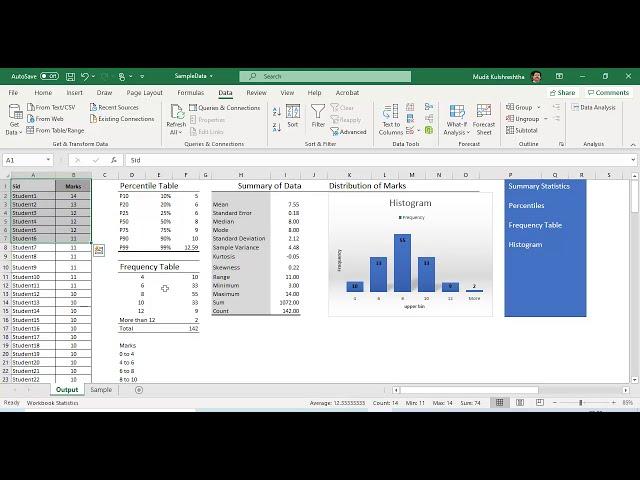
Statistics in Excel Tutorial 1.1. Descriptive Statistics using Microsoft Excel
Комментарии:

New excel with office 365 has only preview options. The pop up message does not appear when it I click on data analysis option. This is so annoying.
Ответить
Helpfull Thansk
Ответить
What do you do when you get an error that says your input contains non-numerical data even though all your data values are indeed numbers (I checked, made sure the values weren't strings)?
Ответить
As someone who struggles with Excel and is very insecure when it comes to data analysis, I can say this video is perfect to understand the basics. Thank you! Also, I love how you embellished the sheet in respect to the people who would hypothetically then read it. The little details make a huge difference. Great video!
Ответить
Final year student in Statistics so this would really help when finishing and going for a degree
Ответить
Hello. Thank you soo much. My question is to you is that while computing the frequency table should i assume the starting point of lower bin always 0? or this is only for this particular dataset which you have shown? another question is, after getting the Frequency table if i want to delete Histogram, and only want to keep the Frequency table, will that be possible? Also is it possible to calculate Frequency table for more than one column simultaneously or it should always be separate? Please reply.
Ответить
Execcellent job! How do you interpret the analysis in words using ChatGPT? hank you
Ответить
Very well presentation. How can I find your sample data?
Ответить
How to interpret values from summery stats ?
Ответить
Please show how to calculate descriptive statistics in continuous series
Ответить
Can you provide the dataset?
Ответить
Great Job Sir
Ответить
i have raw data ( related incident cases), and please assists, tq
Ответить
Thank you for the sharing and need more , great
Ответить
Good morning, sir. I have problem with descriptive data that is input range contain nun-numeric data. Could you help me fix it, please?
Ответить
Thank you so much! This clear and nice content is more than 1000 videos! I just leant a lot in few minutes. Big up Professor!
Ответить
He did that!!!! Loved watching him move throughout excel like a master! I’m taking intermediate business applications and i hope to become this proficient one day! Thanks for the video!
Ответить
Thank you so much..
It is very useful 😊

I watched this 1 hour to my interview and it was worth it.
Ответить
nice video, thanks.
Ответить
Thank you for teaching and that was fun and challenging
Ответить
Thank you soo much
Ответить
Really great video. Clear and makes me more confident on my data analysis journey. Cheers bro!
Ответить
Very simple and straight forwards explanations and example. Thank you!
Ответить
Thank u so much sir
Ответить
thanks
Ответить
Thank you Sir. It really helped me very much.
Ответить
Thank you very much for sharing good information.
Ответить
Thanks for a great simple video to understand for my uni assignments
Ответить
Well presented
Ответить
Excellent presentation !!
Ответить
Thank you very much
Ответить
Thanks a lot, very educative.
Ответить
oh yah!!
Ответить
where can i get the next video of the same topic descriptive statistics
Ответить
Hey man, thank you for this wonderful video, it helped me to complete my assignment and I have learned so many things.
Ответить
Hello there, many thanks for a great video, very well done. I do have a question, what tool do you use to create the video?
Ответить
very useful presentation! straight to the point! Thanks!
Ответить
Thanks for proving these additional videos sir
Ответить
Wonderful explanation 😁
Ответить
Great video very informative and helpful. Thank you
Ответить
kolum ech
Ответить
Thanks
Ответить
How we make range of numbers if we also have negative values in our data how we range them did we range them first then we range posiyive values like
-0.5 to - 2
-2 to -4
0 to 4
4 to 6

Thank you!!!!
Ответить
if Mean>median, it should be positively skewed. why some cases descriptive analysis table shows negative skewness
Ответить
Sir ,Is there a way I can down the data set which you are using it
Ответить
The median value for the Decimal Number for 50% is Different as compared to 50 Percentile eg Median=3.695 and 50 percentile is 3.655 is this possible or am i doing wrong? Thanks
Ответить
How we make range of numbers if we also have negative values in our data how we range them did we range them first then we range posiyive values like
-0.5 to - 2
-2 to -4
0 to 4
4 to 6

my mode is not coming what to do pls say
Ответить


