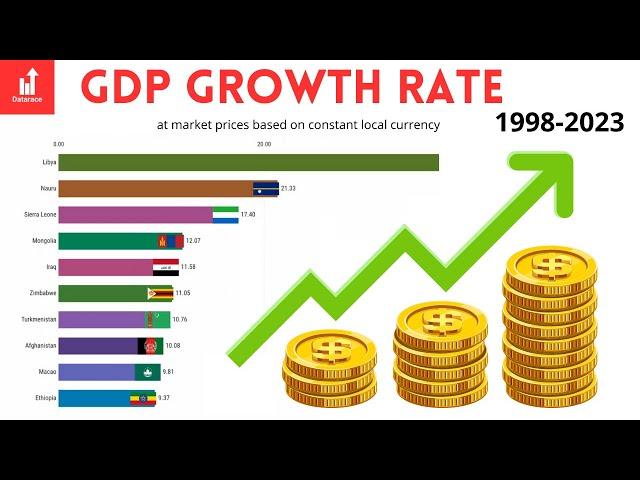
GDP GROWTH RATE by Country: 1998-2023 | Horizontal Bar Chart Timelapse
Curious about which countries have experienced the highest GDP growth rates over the years?
Discover the answer with this engaging horizontal bar chart timelapse! Explore the GDP growth rate by country from 1998 to 2023 and see how economic growth has fluctuated across different regions. Witness the rapid development of emerging economies and the economic shifts that have shaped the world.
Whether you're an economics enthusiast, a policy maker, or simply curious about global development trends, this video provides a comprehensive visual journey through the history of GDP growth.
Subscribe for more intriguing stats visualized!
Тэги:
#GDP_Growth_Rate #Economic_Growth #Horizontal_Bar_Chart #Timelapse #1960-2024 #Global_Economy #Country_Rankings #Data_Visualization #Economic_Trends #Emerging_Economies #World_Development #Economic_AnalysisКомментарии:
ARRIVATI IN ITALIA, CHE SI FA??? una nuova meta!
Nazario Nesta
MANUK GHAZARYAN BAND
Kozlov Club
Посылка из ИНДИИ ТРАВКИ обзор аюрведы МАГАЗИН индийские ТОВАРЫ
Вячеслав Орлов - Йога терапия Аюрведа Здоровье
Early Rapier or Sidesword
scholagladiatoria


