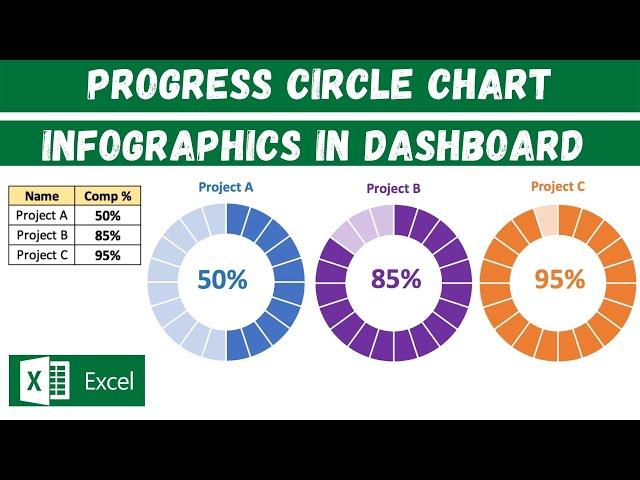
Progress Circle Chart Infographics in Excel Dashboard
Комментарии:

@badiaabatlamous6779 - 11.12.2023 23:02
thank you so much
Ответить
@She-Analyst - 03.08.2023 11:51
Man you are gooooood
Ответить
@premsubs3951 - 10.12.2022 00:54
What if the percentage has reach more than 100% the graph's color is decreasing.
Ответить
@Sidharth.Pratap - 08.12.2021 19:51
Awesome 👍🏻
Ответить
Guess the Sweet quiz 3 | Timepass Colony
Timepass Colony
大鳥スクエアダンスの会 第34回 プラスパーティ 太田久美子 ハッシュコール
ミンちゃん - 北本スクエアダンスクラブ Mints
Tim's Kitchen Tips -- Episode 4
Tim and Eric
【冬季奧運開幕典禮】 經典樂曲 IMAGINE 展現冰雪運動之美
愛爾達體育家族 ELTA Sports
How BBC pranked an entire country
OneMinuteThings
Bad smell & Pet sitters | Topsy & Tim Double episode 109-110 | HD Full Episodes | Shows for Kids
Topsy & Tim - WildBrain
How to Write GOOD Product Documentation | PRD, Design Specs, and more!
Deborah Bittencourt


